The past few years I’ve used Fawn Nguyen’s Visual Patterns site as the structure for building an 8th graders understanding of linear relationships. Students GET patterns–even the most struggling learners can identify what’s happening in a linear pattern and complete a table of data points. What I’ve done recently is used the patterns to build an understanding of finding the constant rate of change between two points. Here is an example of what the students are presented with… Instead of giving the students something like this:  I give them this:
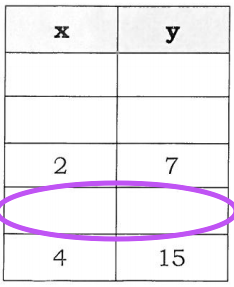
  The students work on their dry erase board to create an input-output table of data points beginning with x is 0. We’ve spent A LOT of time creating our own tables that it has really started to become second nature. I didn’t tell them how to figure out the missing figure numbers…they just figured it out on their own. Without prompting…the students even wrote the rule for these situations (I had only asked for the rate of change). We worked through several problems like this on dry erase boards (pulling from Visual Patterns each time) and then went to problems like this:
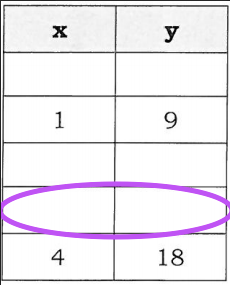
  and this…
  With these problems I asked them to determine the (x, y) values that would fill the purple oval. Again, without prompting, they wrote the rule for this relationship. The follow up to this activity was via @Mathalicious …I used their Domino Effect task which was a great follow up to the missing figure number dry erase activity. Students felt very confident in their ability working through that task completely independently. Here is a set of 5 Missing Figure Images…thanks to @fawnpnguyen for her great resource!!!

[…] Bridget Dunbar (@BridgetDunbar) uses Fawn Nguyen’s Visual Patterns website to help her students understand finding the constant rate of change between two points. […]
LikeLike
Reblogged this on Reflections in the Plane.
LikeLike